 Luke Stackwalker
Introduction

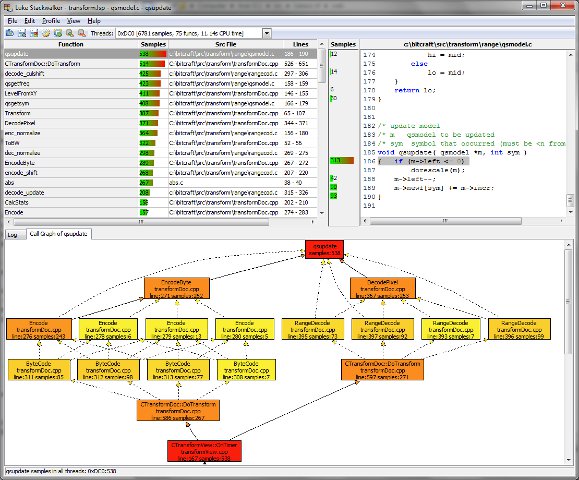
A screenshot of Luke Stackwalker displaying profiling results.
Luke Stackwalker is a C/C++ code profiler that runs on Windows.
It uses call stack sampling to collect profile data, so no code instrumentation is required.
Luke Stackwalker can sample the call stack at an user-specified depth to not only provide a display of which functions in the program under test consume most CPU time, but it can also display a call graph showing how the program got there.
Feature list
- Per-function CPU time cost view
- Syntax-colored source code display showing stack samples per source line
- Call graph display showing the call graph to a user-selected function in the function cost display
- Supports multithreaded apps:
- Stack is sampled on all threads of the target program.
- Sample data can be viewed for a single thread or multiple selected threads simultaneously
- Uses Microsoft symbol servers to load debug information for system DLLs
- Profiling project settings can be saved and loaded
- Profile data can be saved and loaded
- Supports profiling both 32 and 64 bit applications
For more information, see the user's manual.
Current limitations:
- Call graph collection works best for non-optimzed builds
- Does not support binaries generated with GCC
Downloading
You can download Luke Stackwalker from
here.

